Arley Schenker
Data Analyst

I am a data analyst with particular strengths in Python and SQL analysis. As Partner Analytics Associate at Liftopia, I gained experience in e-commerce analytics and optimizing data workflows for efficiency and clarity. I studied psychology at Carnegie Mellon University and Bucknell University and transitioned into data analytics after pursuing additional education at UC Berkeley Extension. As a scientist, I thoughtfully consider all aspects of questions I encounter and work to find the best solutions.
Work Experience
End of Season Reports
I automated the production process for client-facing end of season reports, increasing efficiency and consistency.
Presale Revenue Case Study
I authored a case study describing the revenue opportunity for offering tickets online before a ski resort opens.

Off-Peak Days Case Study
I performed an analysis describing how dynamic pricing can increase revenue on off-peak days (ie midweek) compared to typical window sales.

Personal Projects
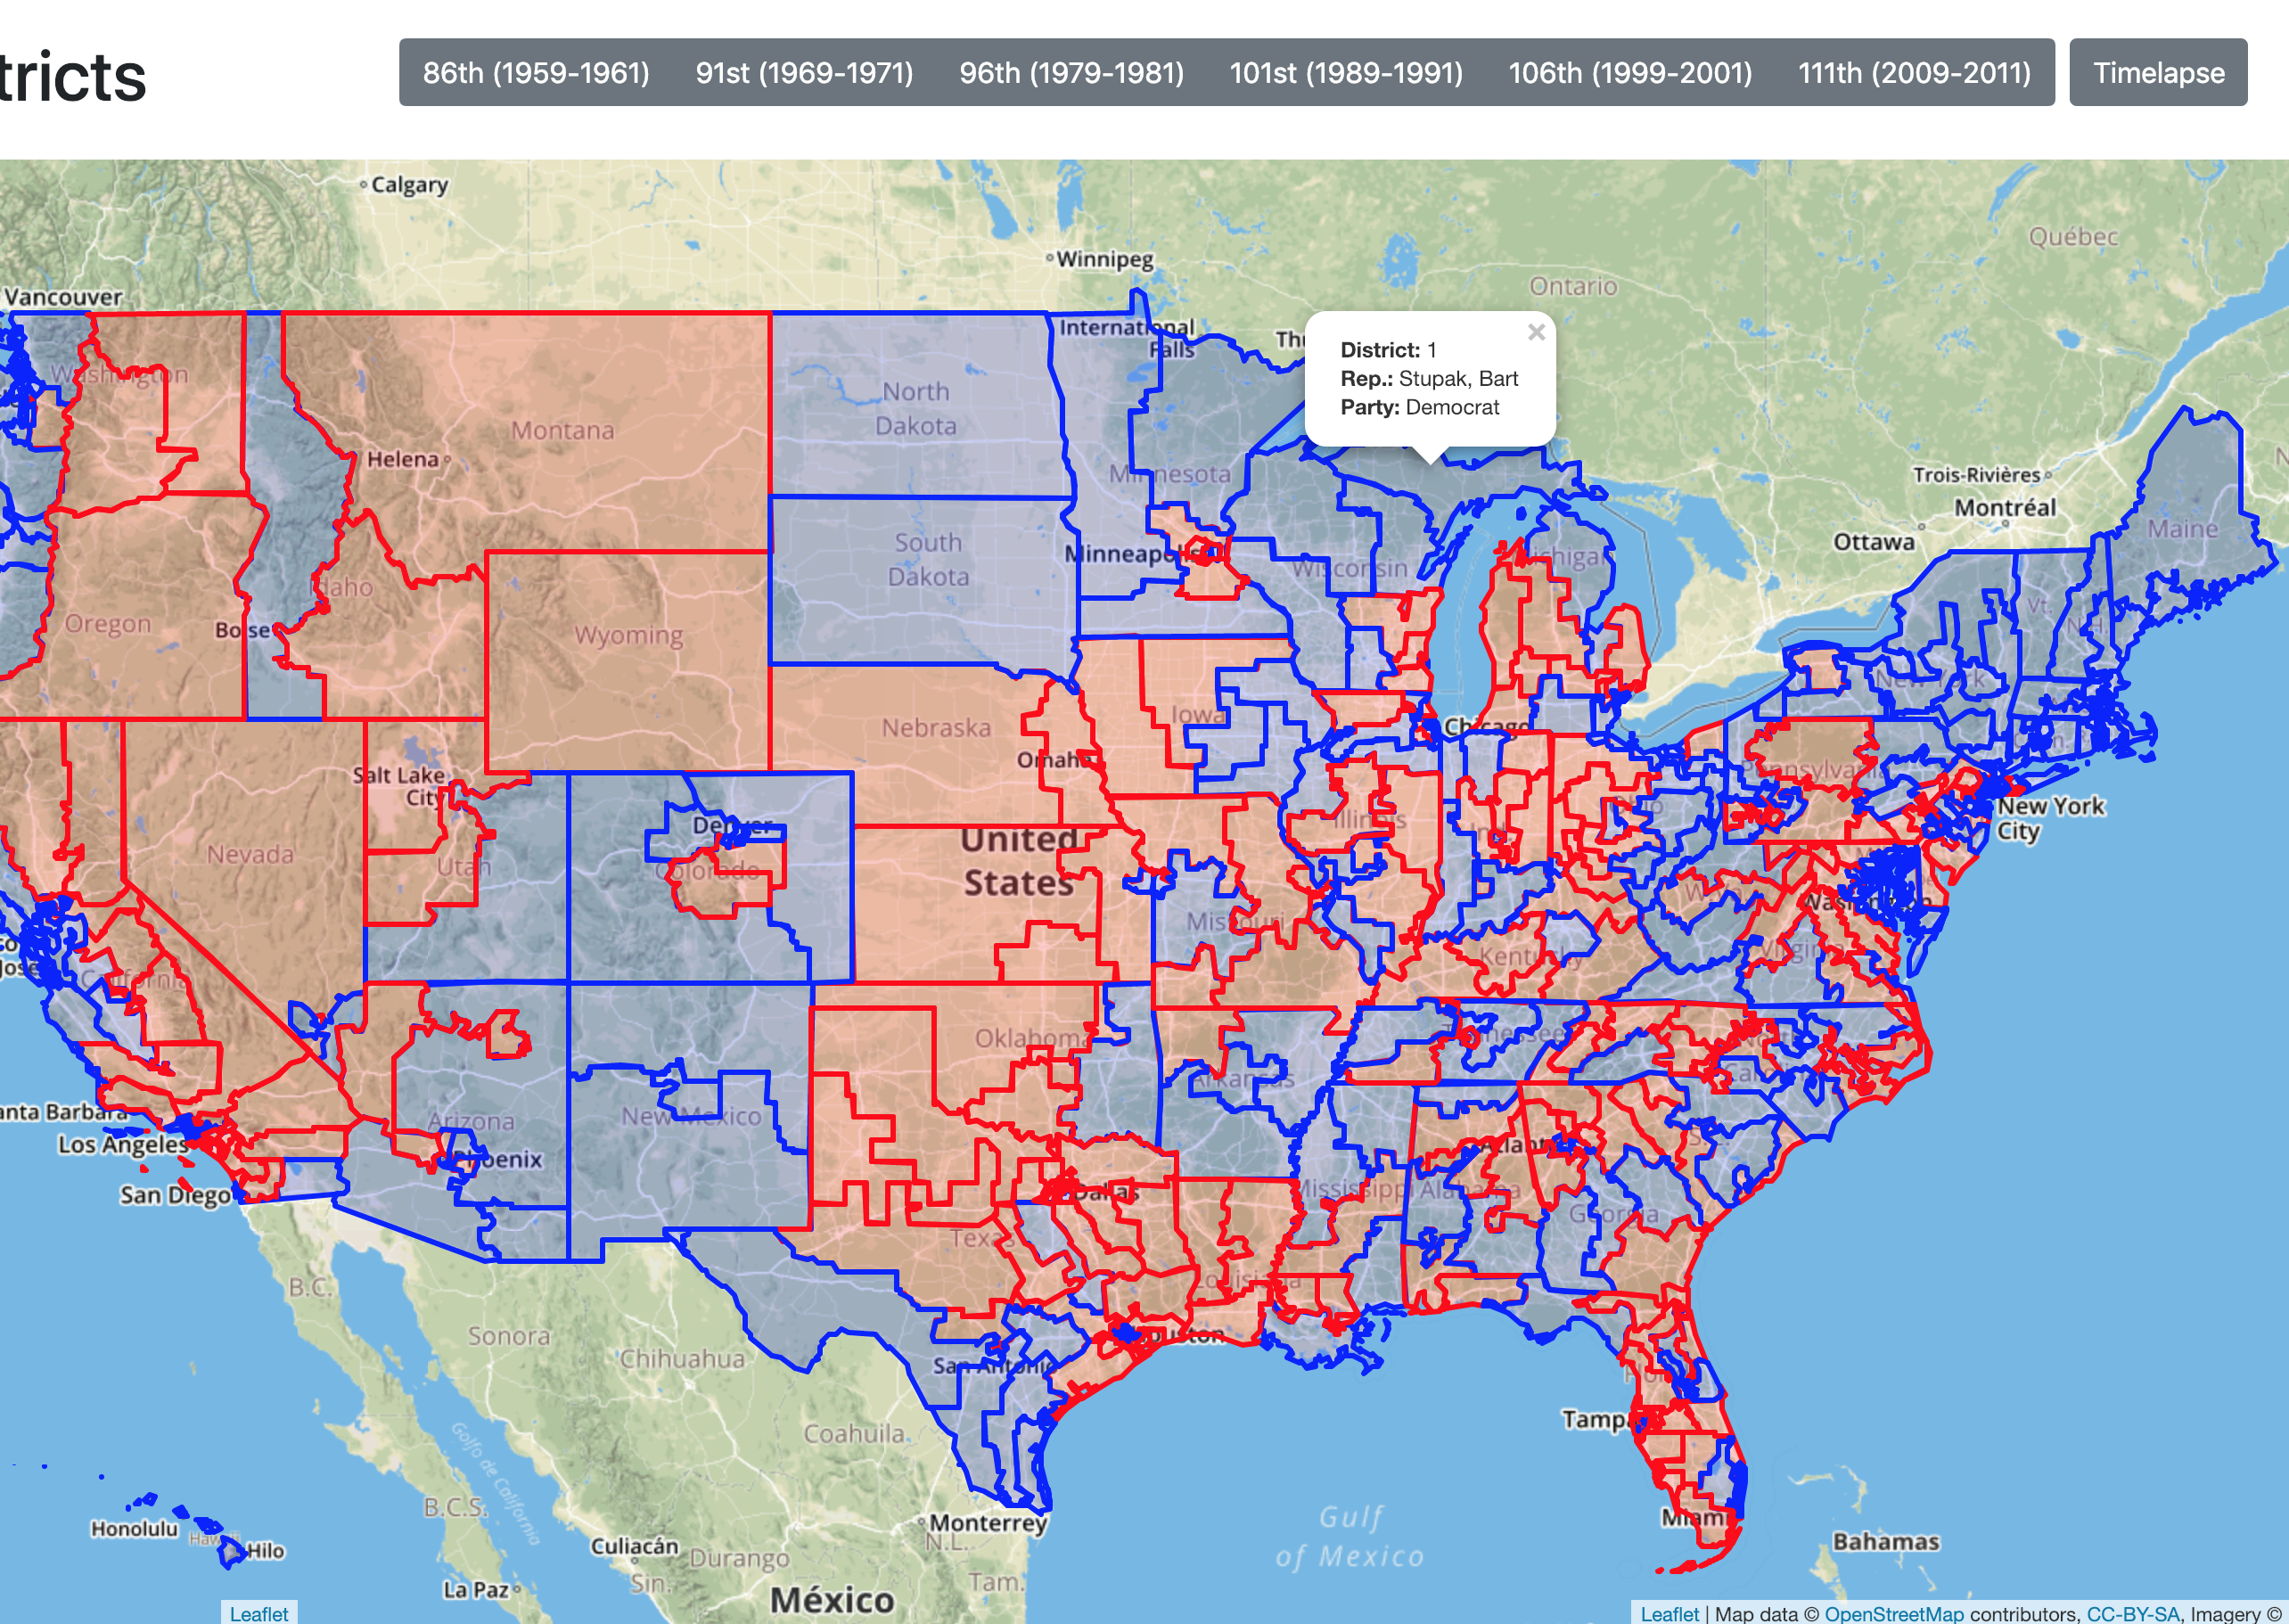
Gerrymandering Analysis
Created interactive Leaflet map using historical Congressional district data. Visualized trends with scatter plots.
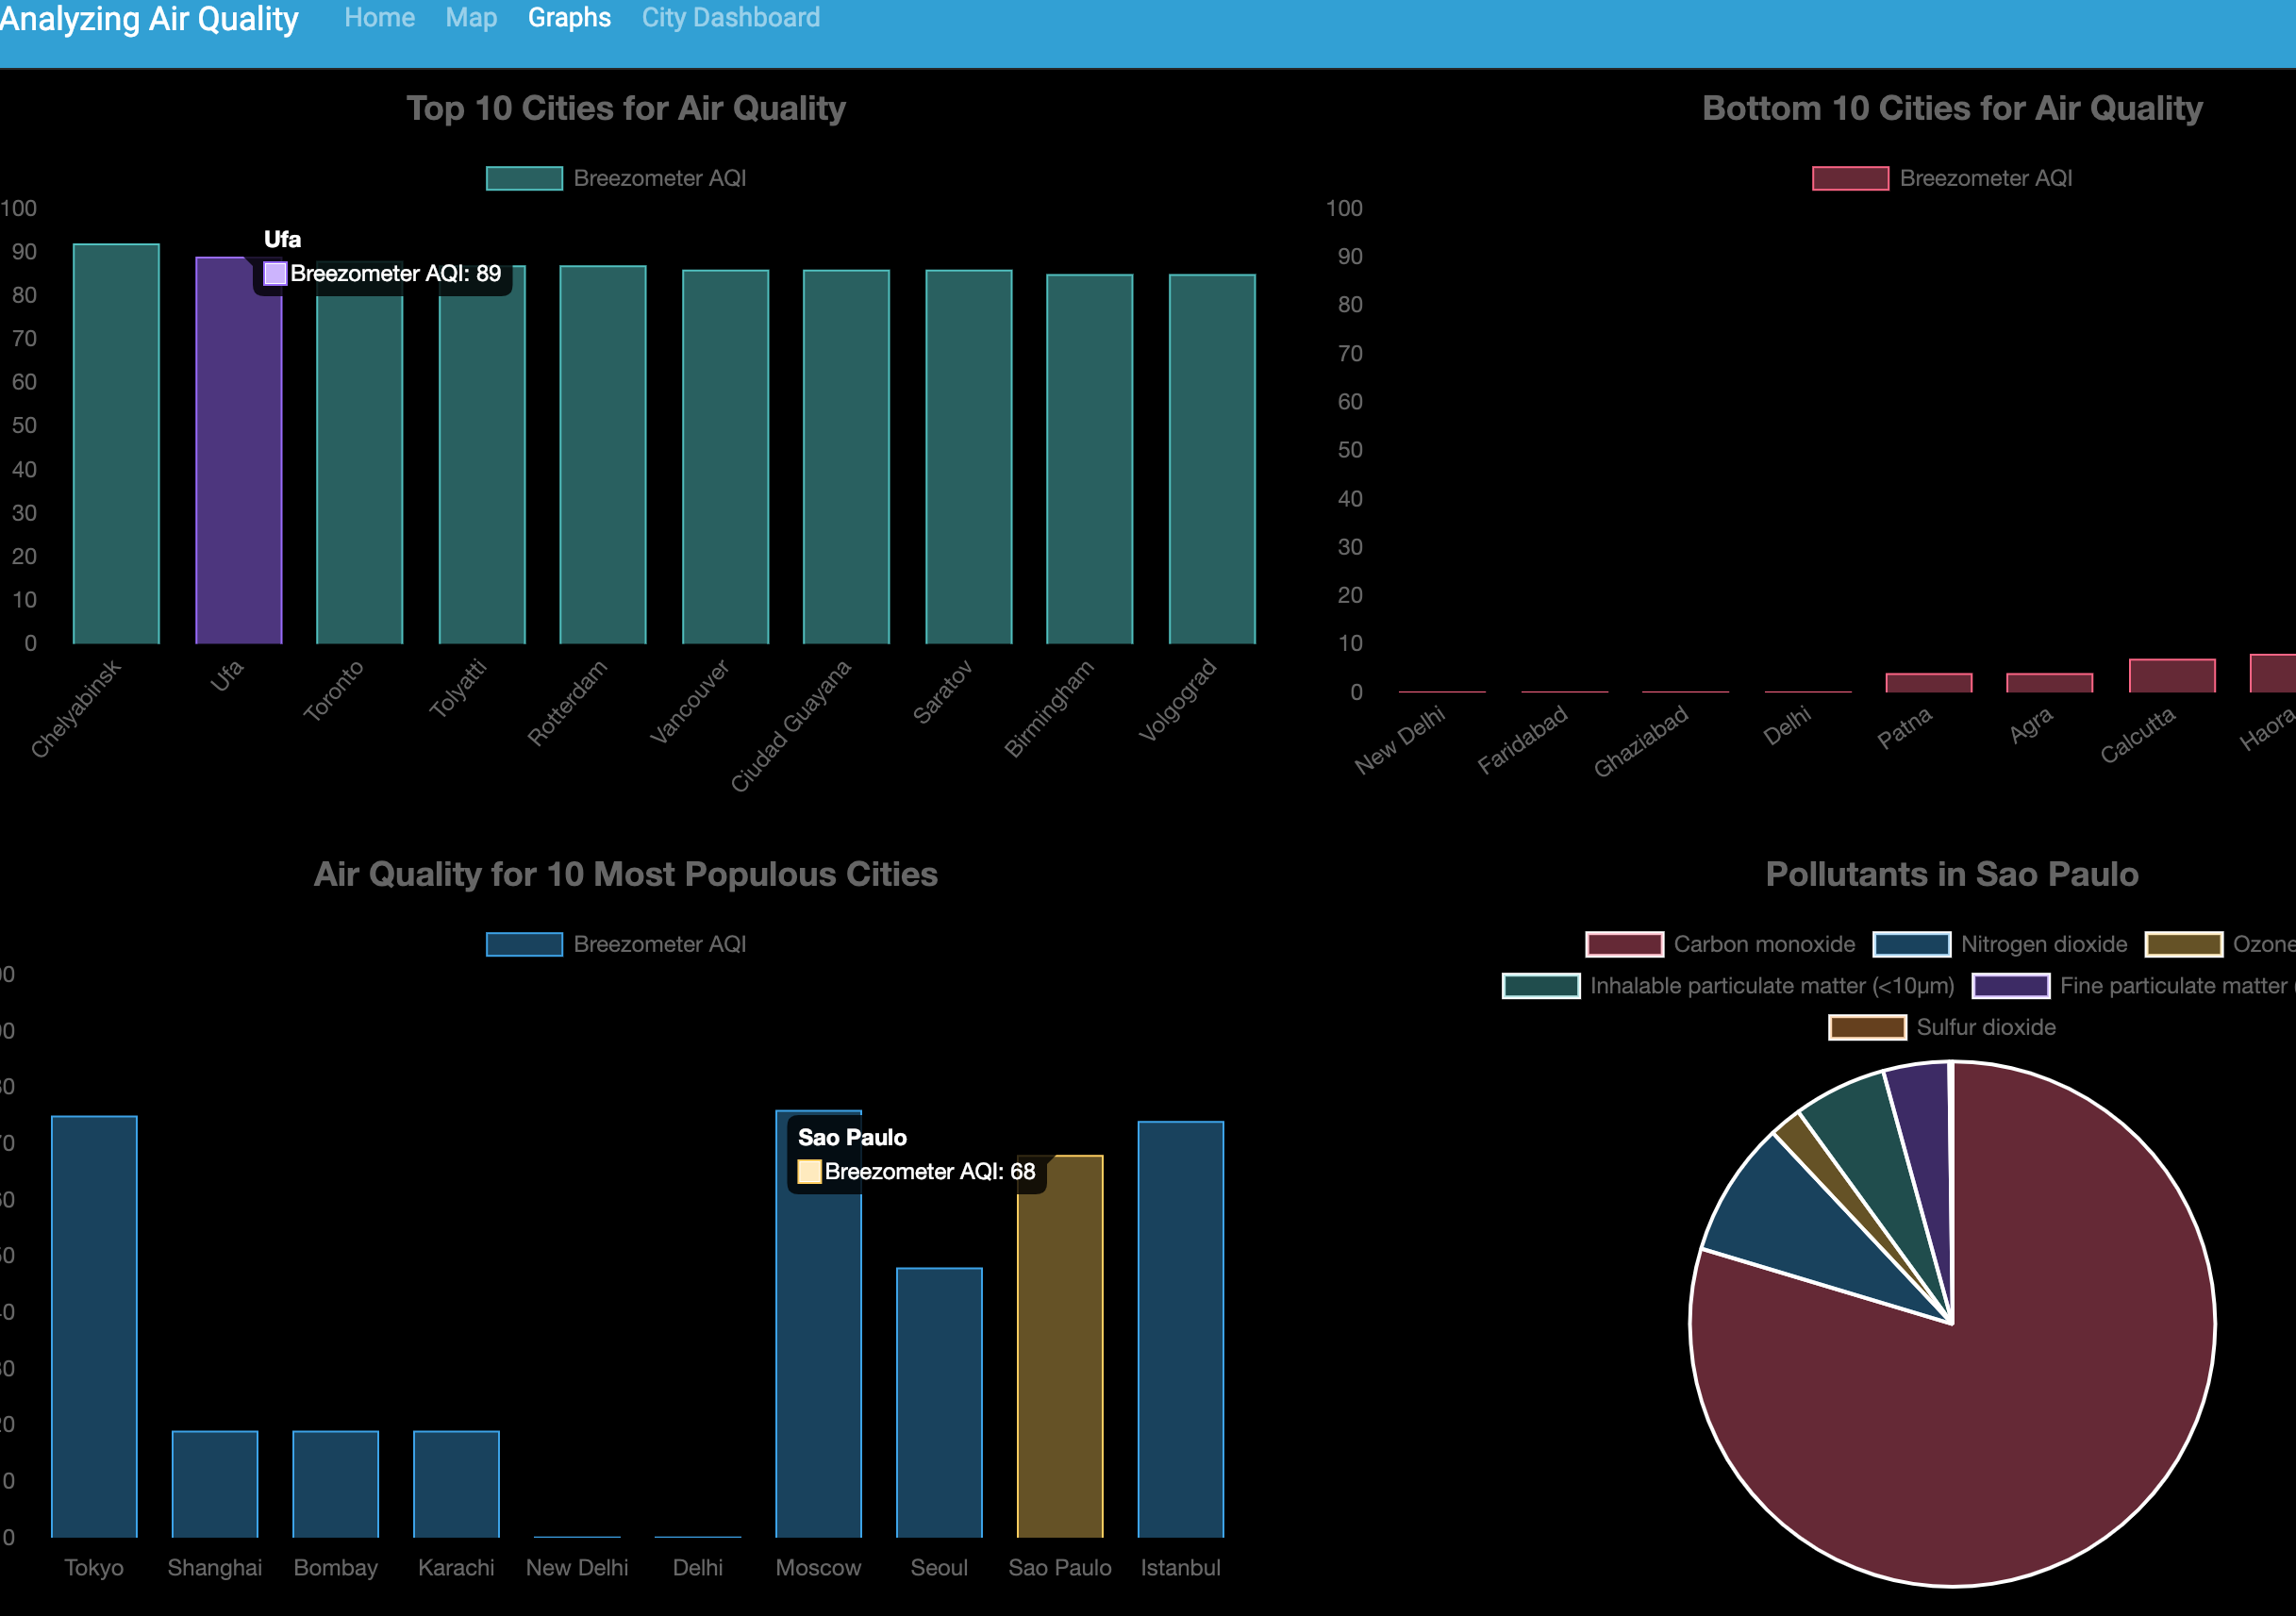
Air Quality Dashboard
Collected data for and designed graphs and city dashboard pages for an air quality dashboard website.
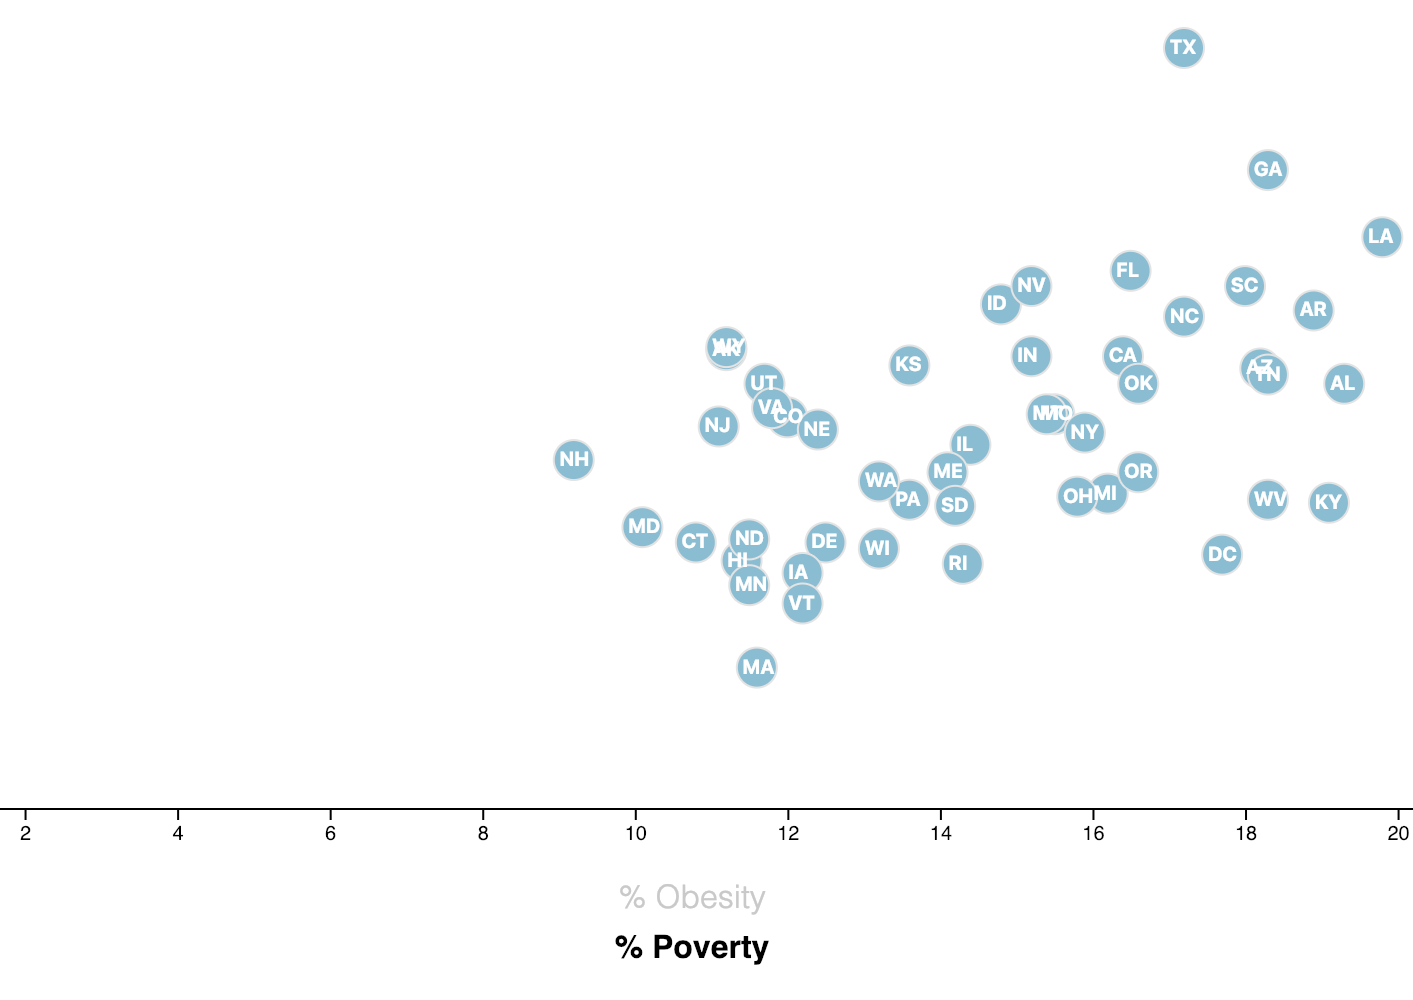
D3 Animated Scatterplot
Created scatter plots in d3.js with custom animations and tooltips to visualize demographic data.
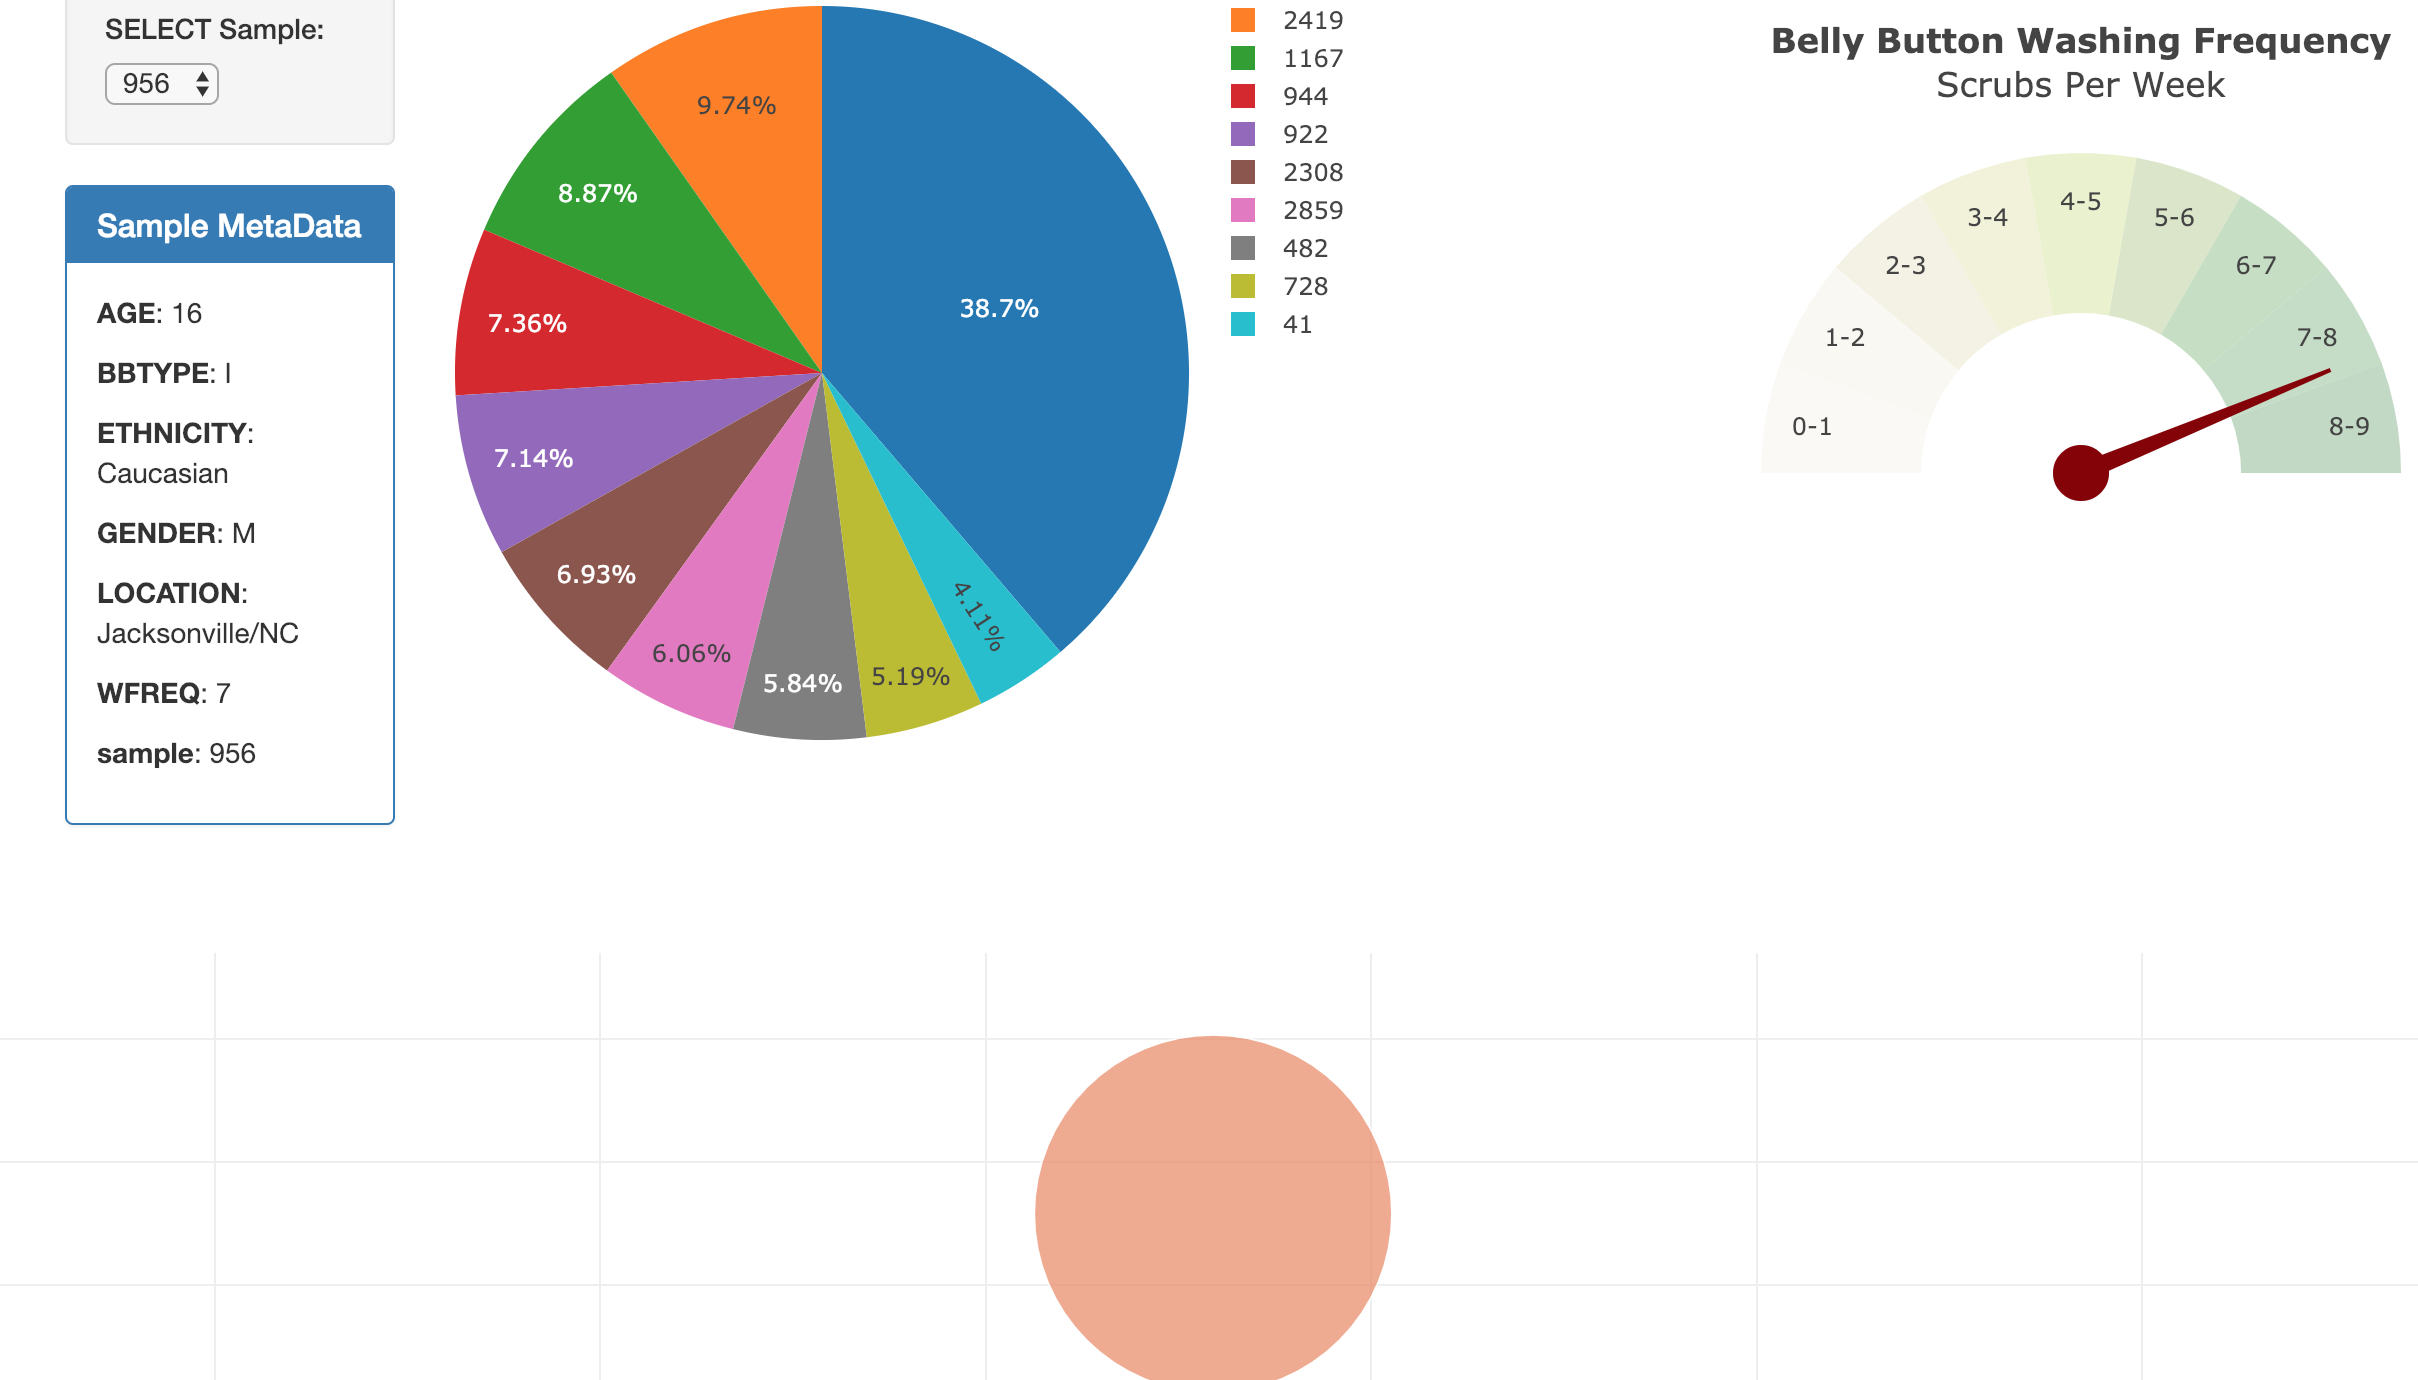
Biodiversity Dashboard
Created a dashboard of data regarding the biodiversity of the belly button with Plot.ly and Javascript.
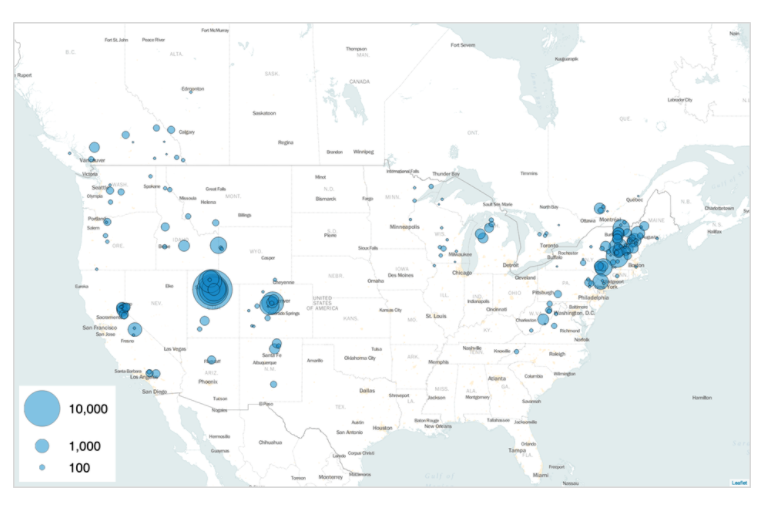
Farmers' Markets Analysis
With classmates, created a series of analyses and visualizations about farmers' markets in the US using Matplotlib and Python gmaps.

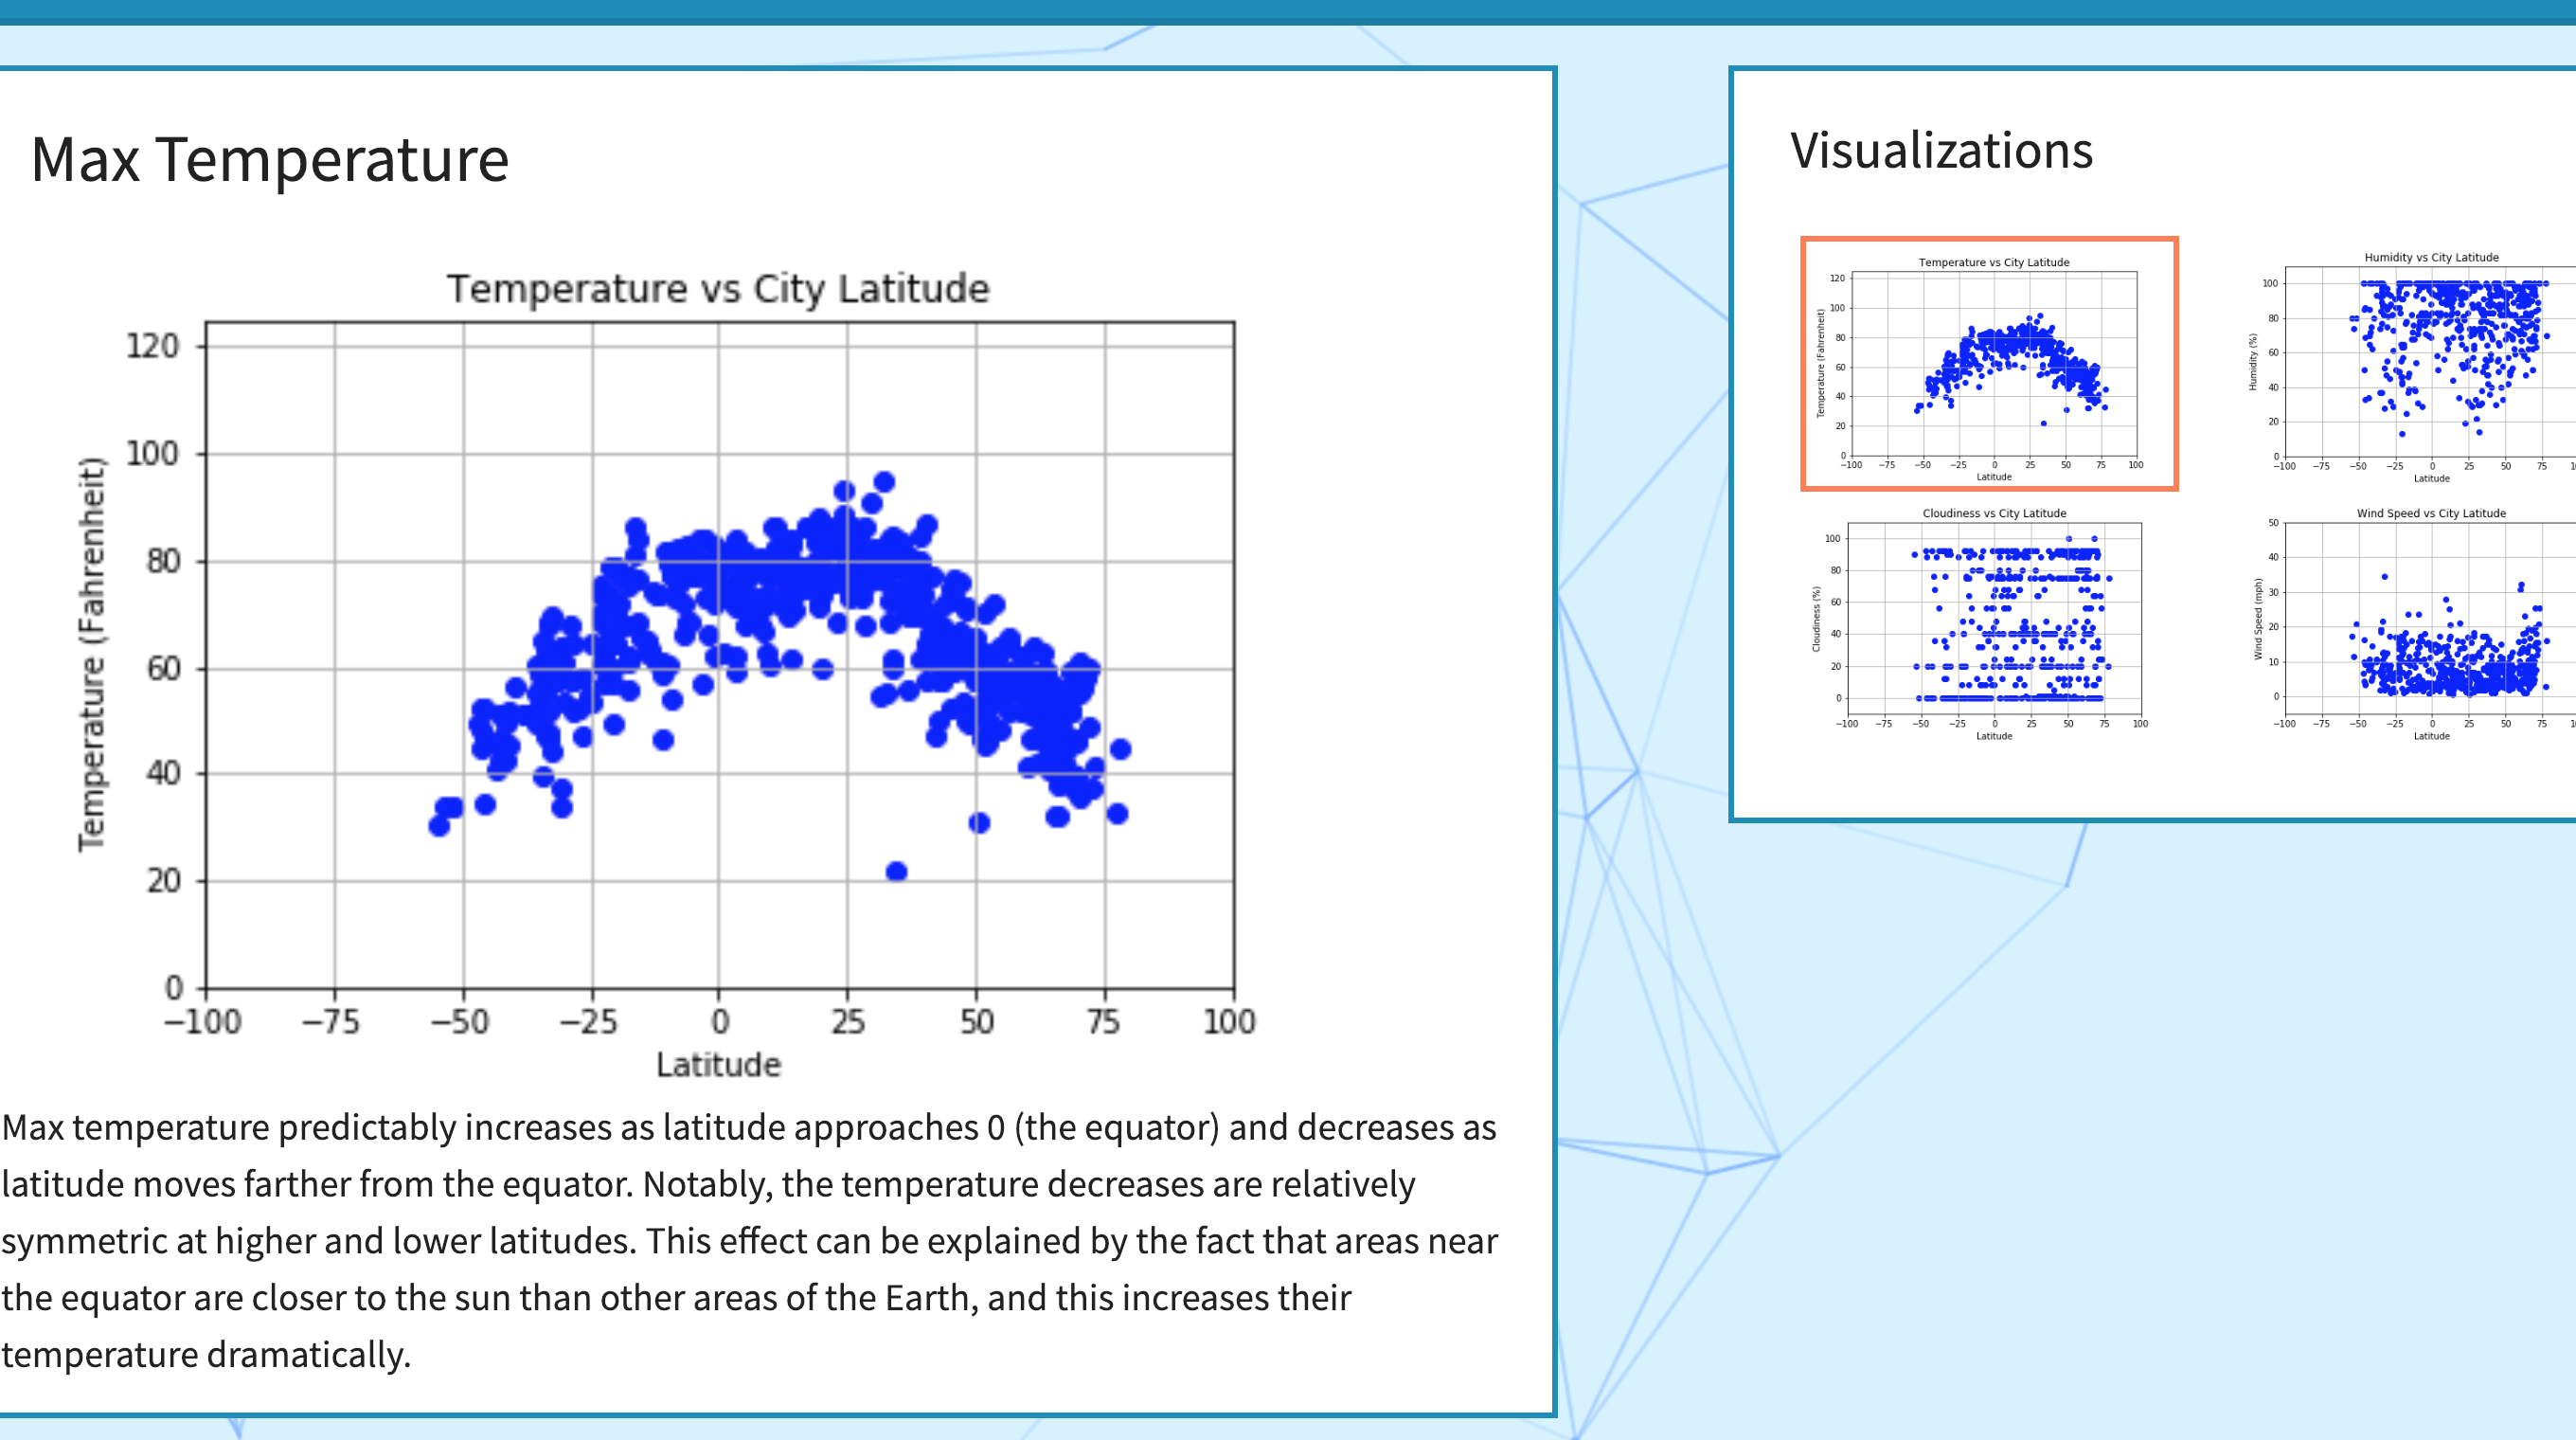
Latitude Data Webpage
Analyzed public weather data to determine whether latitude was related to temperature, humidity, cloudiness, or wind speed.