Biodiversity Dashboard
November 2018
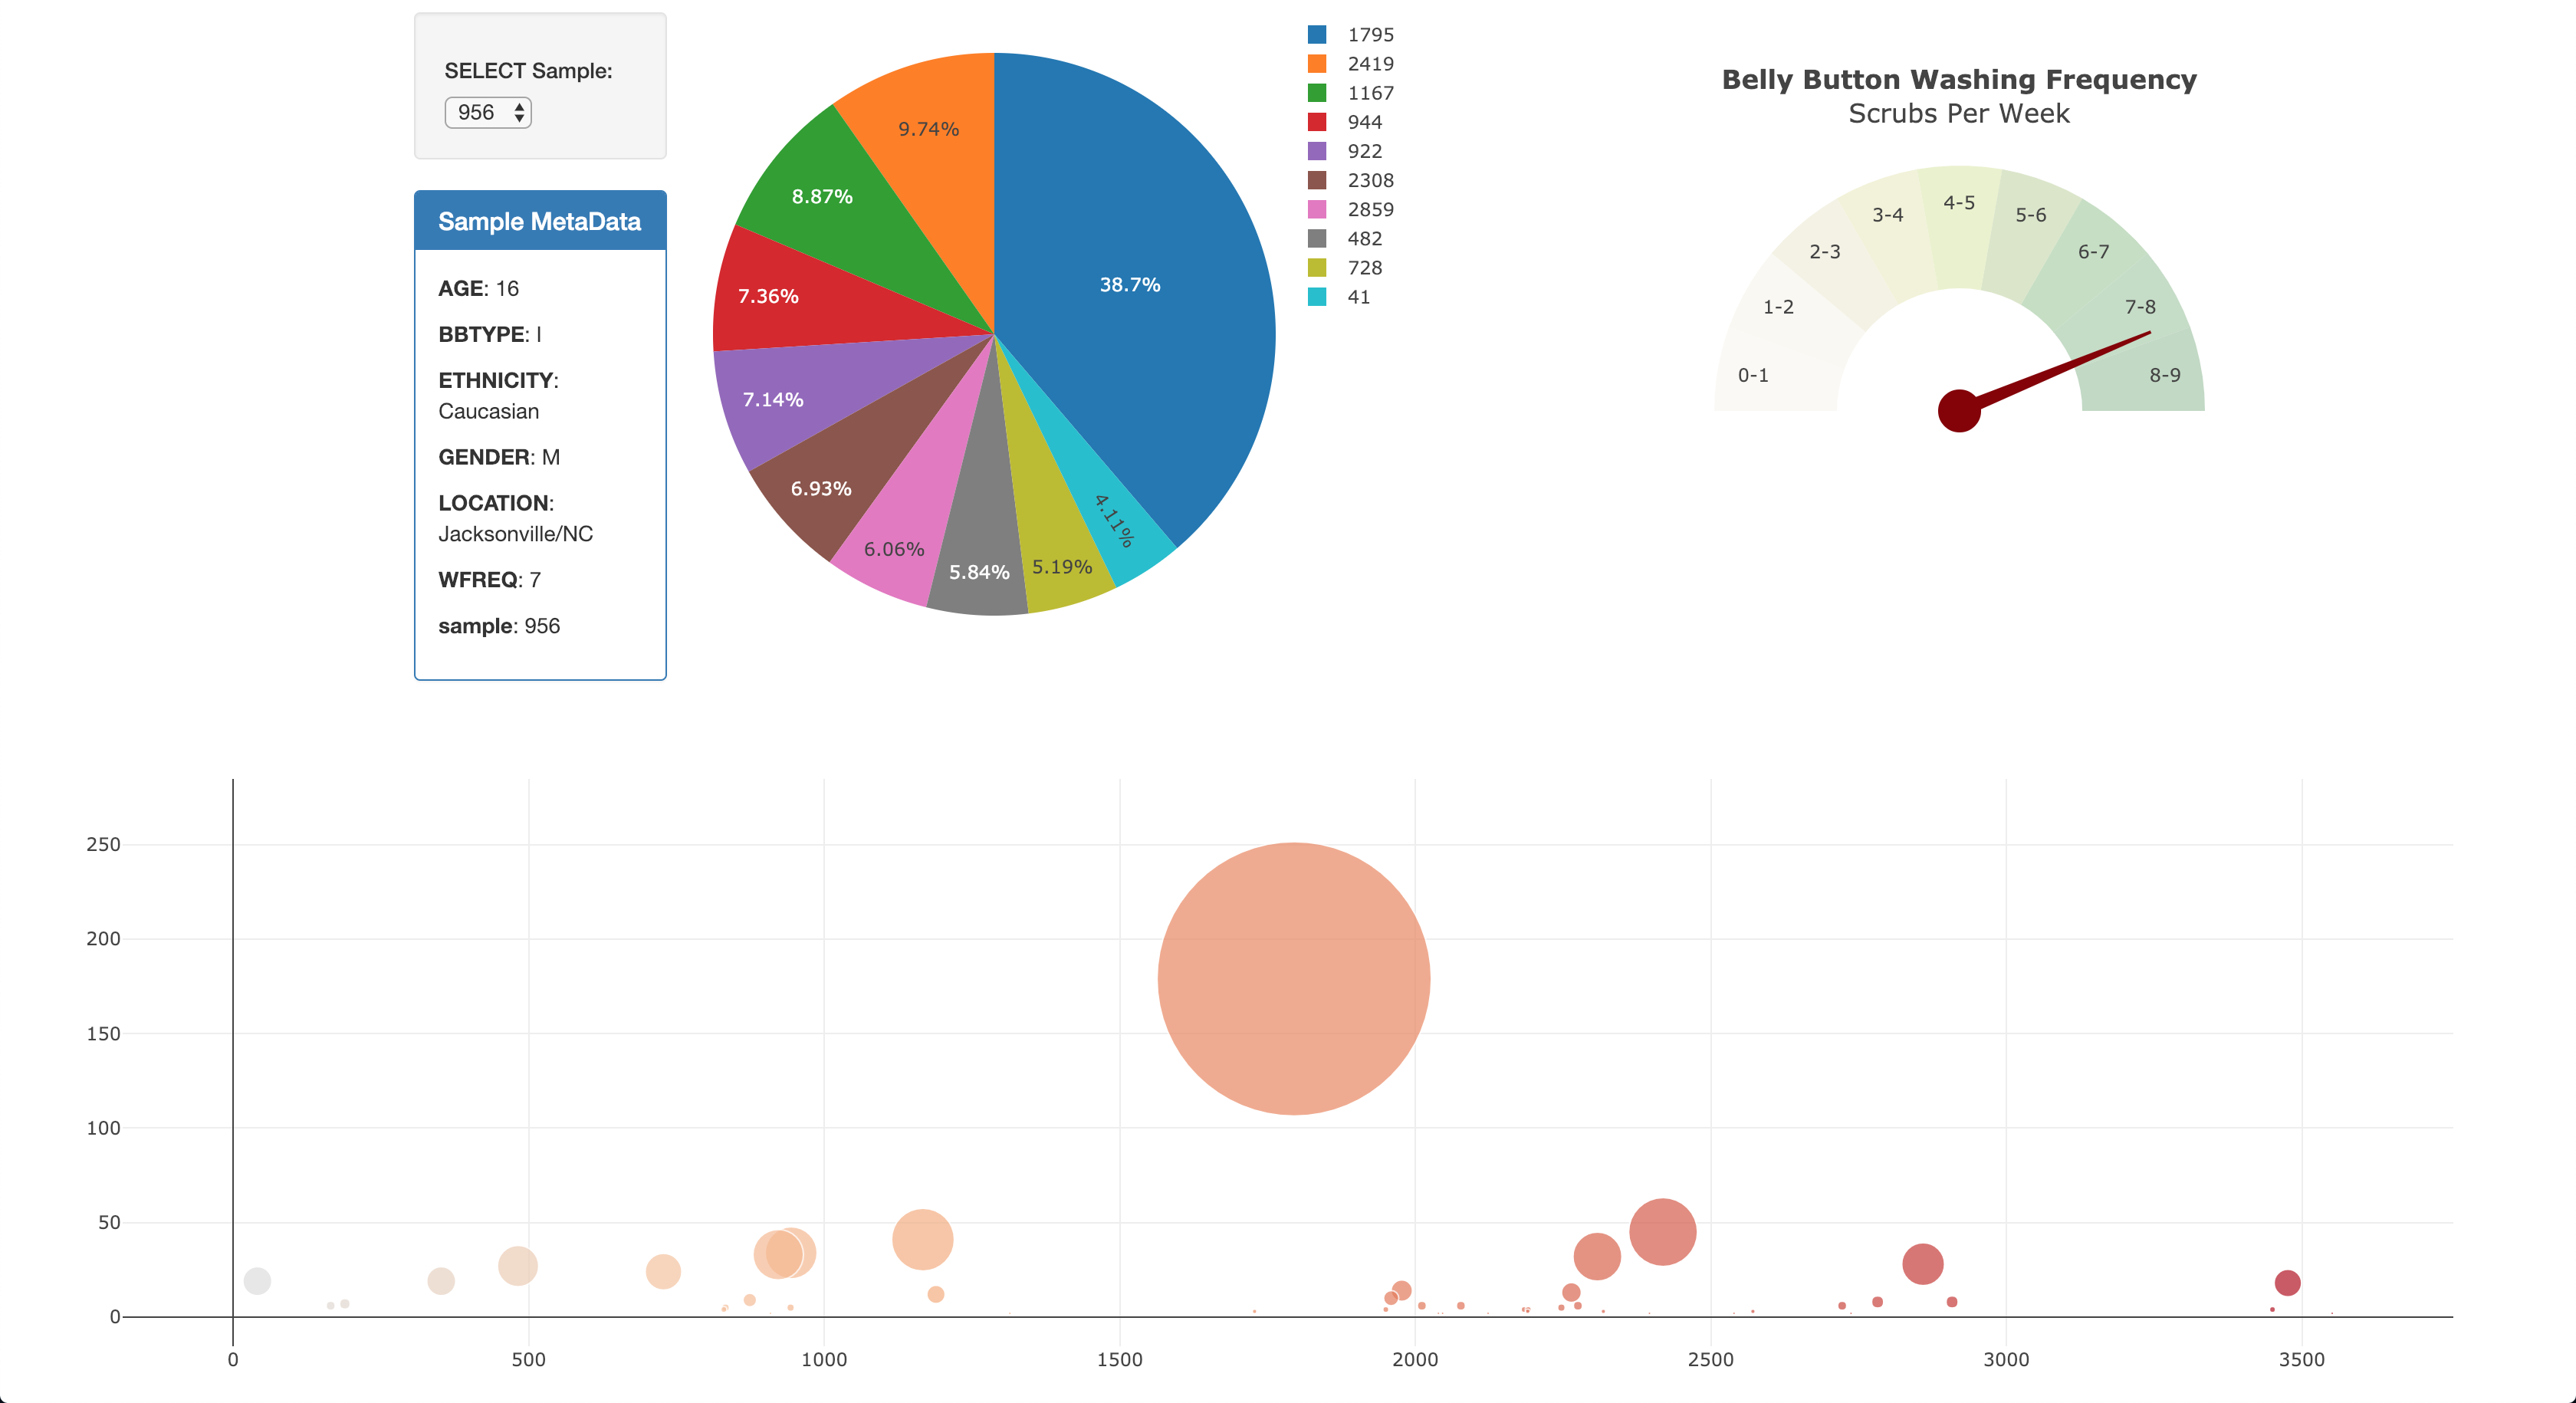
I used public data regarding the biodiversity of the belly button to create a dashboard detailing several aspects of the data. These were visualized using interactive bubble and pie charts in Plotly.js and a dropdown powered by d3.js. The use of these tools makes the data easily accessible to anyone curious about the bacteria living in their belly buttons.
