Air Quality Dashboard
November 2018
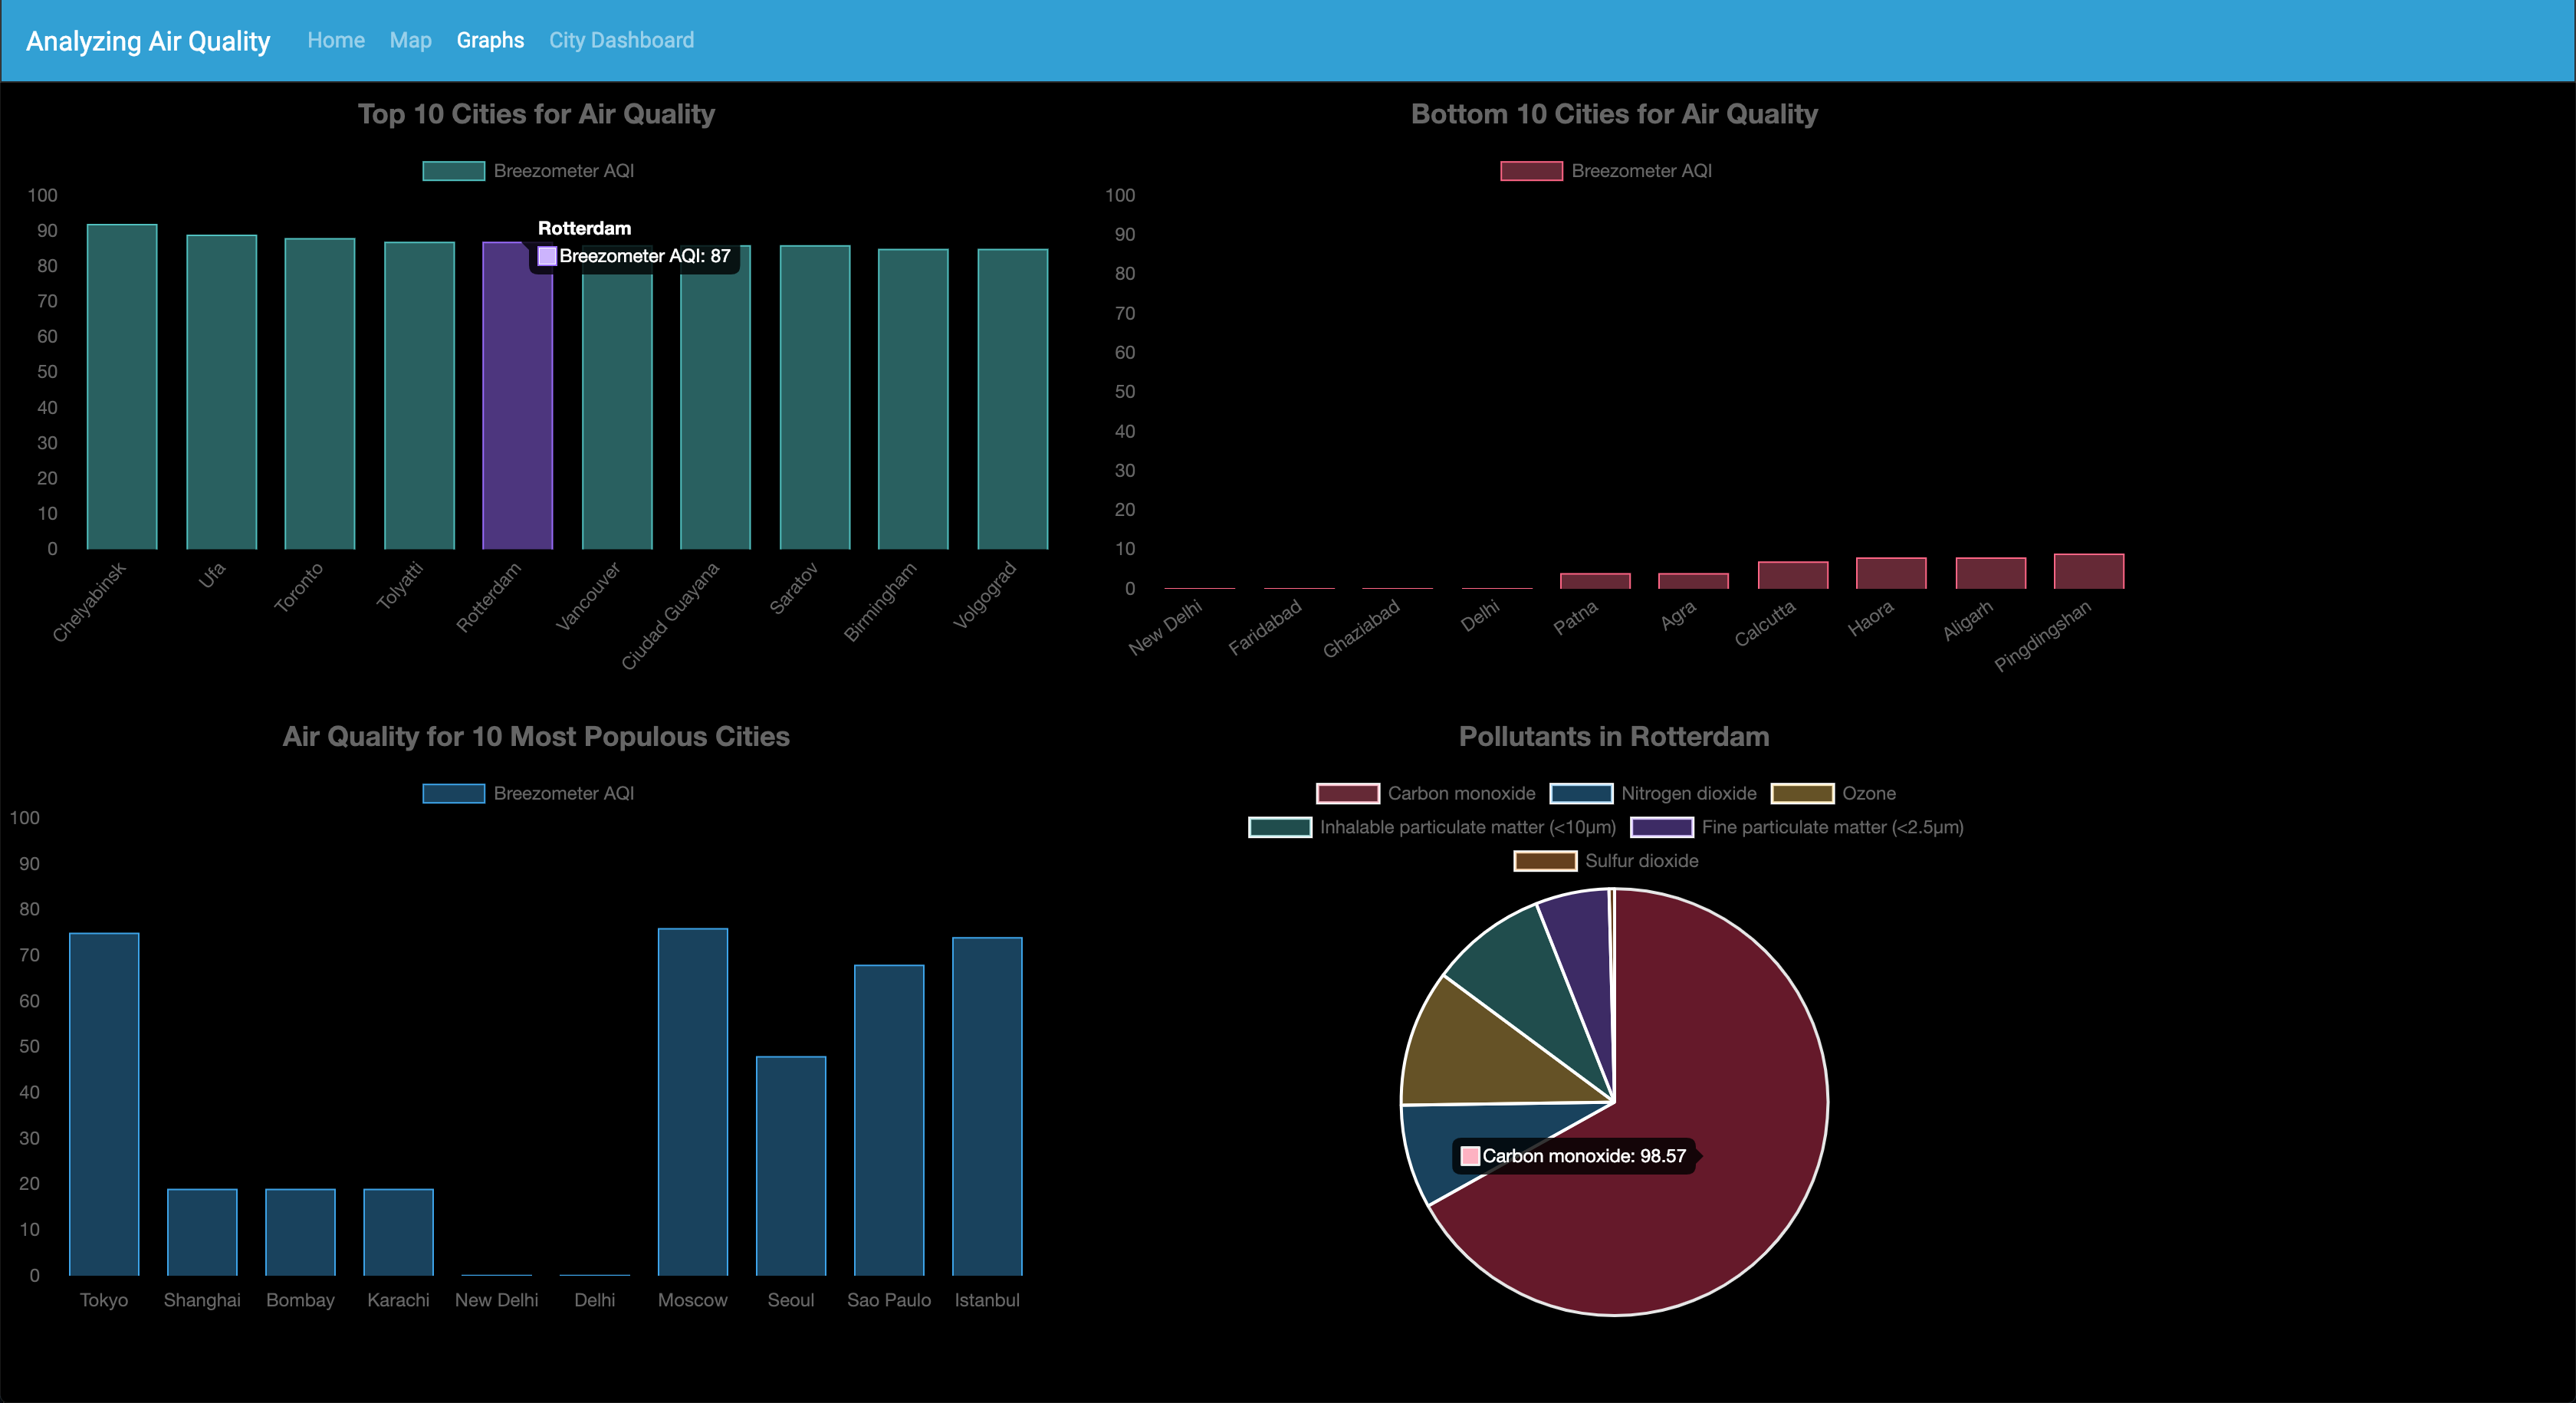
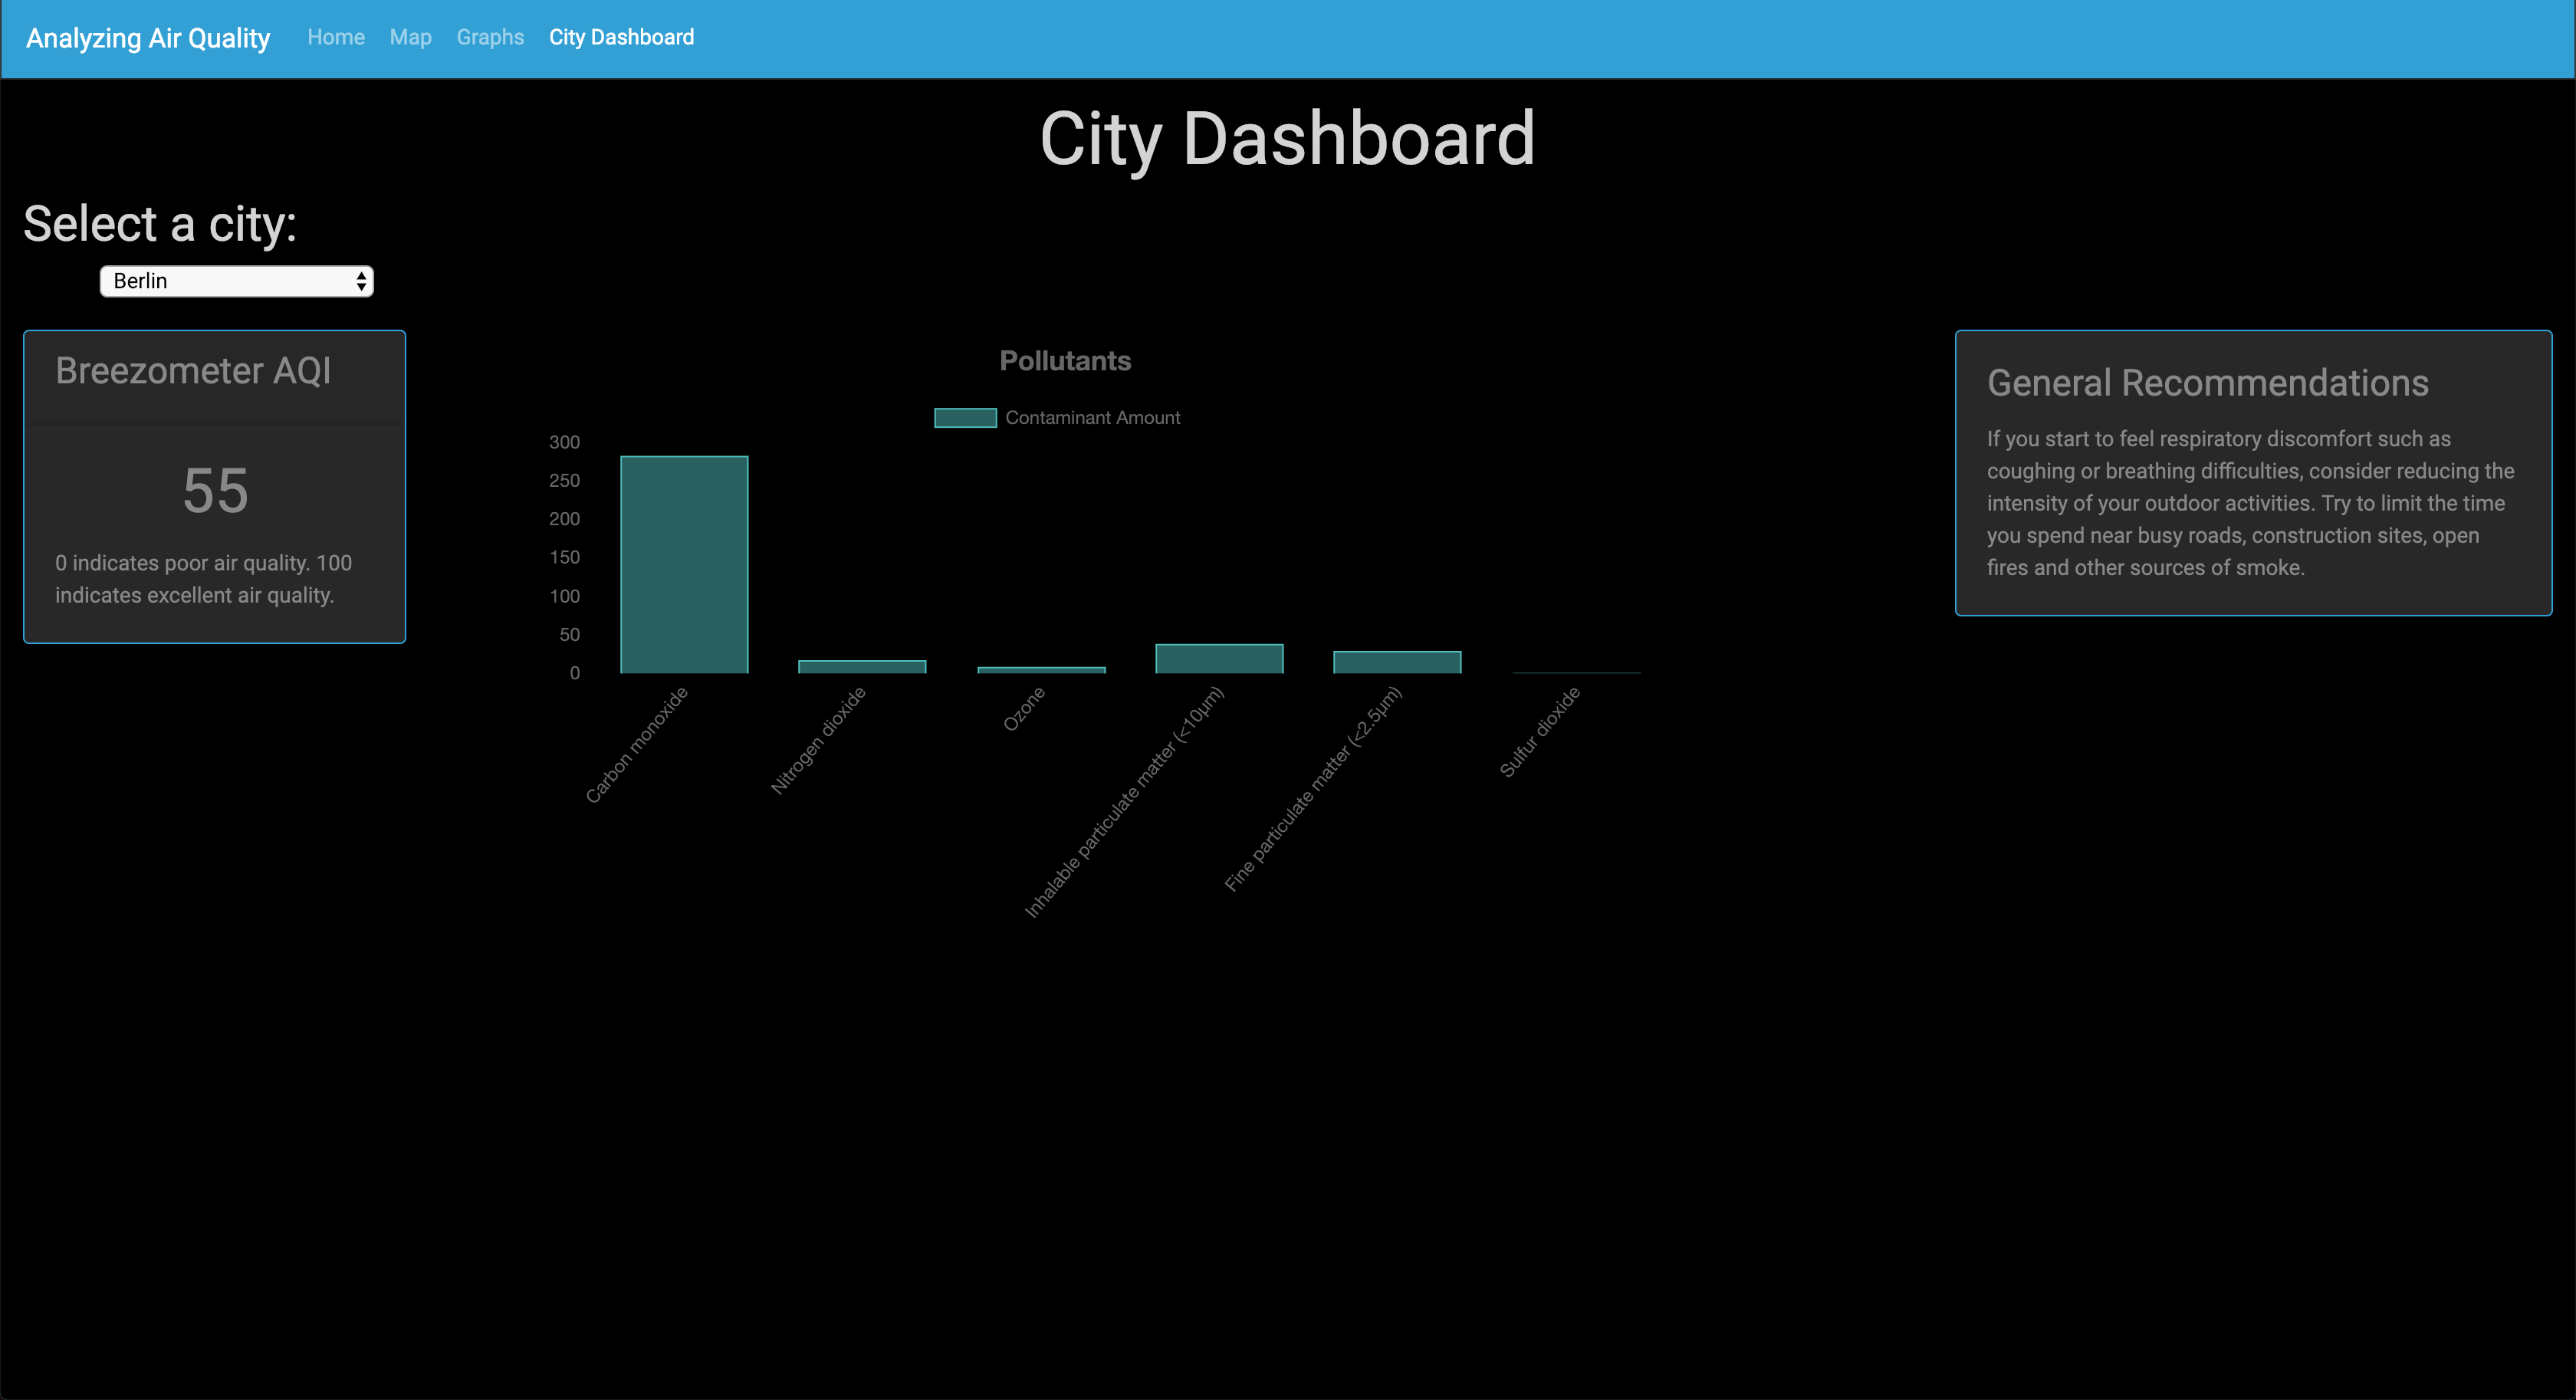
In the wake of the Camp Fire earlier this year, some classmates and I created a dashboard that gathers and displays data about air quality for cities around the world. The dashboard uses HTML/CSS, d3.js, Leaflet.js, and Chart.js. My major contributions to this project were creating the Graphs and City Dashboard pages, which feature interactive graphs about air quality pollutants and recommendations for a city that the user has selected. I also oversaw the deployment of the app to Heroku.

